Graphs of trigonometric functions, transformation of graphs. Converting graphs of trigonometric functions Examples of converting graphs of trigonometric functions

 Live Journal
 Facebook
 Twitter
ALGEBRA
Lessons for 10th grade
Subject.Graphing trigonometric functions
Objective of the lesson: plotting functions y = sin x, y = cos x, y = tg x, y = ctg x.
Formation of skills to construct graphs of functions: y = Asin (kx + b), y = Acos (kx + b), y = Atg (kx + b), y = Actg (kx + b).
I. Checking homework
1. One student reproduces the solution to exercise No. 24 (1-3).
2. Frontal conversation:
1) Name phenomena in nature that repeat periodically.
2) Give the definition of a periodic function.
3) If the function y = f (x) has a period of the number T, then will the period of this function be the number 2T, 3T ...? Justify your answer.
4) Find the smallest positive period of the functions:
a) y = cos; b) y = sin; c) y = tg; d) y = .
5) periodic function y = C? If yes, then indicate the period of this function.
II. Plotting the function y = sin x
To plot the function y = sin x, we will use the unit circle. Let's construct a unit circle with a radius of 1 cm (2 cells). On the right we will construct a coordinate system, as in Fig. 57.
Let's plot the points on the OX axis; π; ; 2 π (respectively 3 cells, 6 cells, 9 cells, 12 cells). Let us divide the first quarter of the unit circle into three equal parts and the segment of the abscissa axis into the same number of parts. Let us transfer the value of the sine to the corresponding points of the OX axis. We get the points that need to be connected with a smooth line. Then we divide the second, third and fourth quarter of the unit circle into three equal parts and transfer the value of the sine to the corresponding point on the OX axis. Consistently connecting all the obtained points, we obtain a graph of the function y = sin x on the interval.
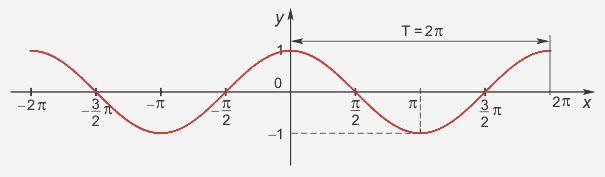
Since the function y = sin x is periodic with a period of 2 π, then to construct a graph of the function y = sin x on the entire line OX, it is enough to parallelly move the constructed graph along the OX axis by 2 π, 4 π, 6 π ... units to the left and to the right (Fig. 58).

A curve that is a graph of the function y = sin x is called a sine wave.
Performing exercises______________________________
1. Construct graphs of functions.
a) y = sin; b) y = sin 2x; c) y = 2 sin x; d) y = sin (-x).
Answers: a) fig. 59; b) fig. 60; c) fig. 61; d) rice. 62.


III. Plotting the function y = cos x
As you know, cos x = sin, therefore y = cos x and y = sin are the same functions. To construct a graph of the function y = sin, we will use geometric transformations of graphs: first we construct (Fig. 63) a graph of the function y = sin x, then y = sin (-x) and finally y = sin.


Performing exercises________________________________
1. Graph the functions:
a) y = cos; b) y = cos; c) y = cos x; d) y = | cos x |.
Answer: a) fig. 64; b) fig. 65; c) fig. 66; d) rice. 67.


IV. Plotting a graph of the function y = tg x
We construct a graph of the function y = tan x using a line of tangents on an interval whose length is equal to the period π of this function. Let's construct a unit circle with a radius of 2 cm (4 cells) and draw a line of tangents. On the right we will construct a coordinate system, as in Fig. 68.

Let's plot the points on the OX axis; (6 cells). Divide the first and fourth quarter of the circle into 3 equal parts and each of the segments and into the same number of parts. Let's find the values of the tangents of the numbers; ; 0; ; using the tangent line (the coordinates of the points ; ; ; ; tangent line). Let us transfer the tangent values to the corresponding points of the OX axis. Consistently connecting all the obtained points, we obtain a graph of the function y = tan x on the interval.
Since the function y = tg x is periodic with period π, to construct a graph of the function y = tg x on the entire straight line OX, it is enough to parallelly move the constructed graph along the OX axis by π, 2 π, 3 π, 4 π ... units to the left and to the right (Fig. 69).

The graph of the function y = tan x is called tangent.
Doing exercises
1. Graph the functions
a) y = tan 2x; b) y = t gx ; c) y = tan x + 2; d) y = tan (-x).
Answers: a) fig. 70; b) fig. 71; c) fig. 72; d) rice. 73.


V. Graphing the function y = cot x
The graph of the function y = ctg x can be easily obtained using the formula ctg x = tg and two geometric transformations (Fig. 74): symmetry about the ΟΥ axis, parallel translation along the OX axis on.


IV. Homework
Section I § 6. Questions and tasks for repeating section I No. 50-51. Exercises No. 28 (a-d).
V. Lesson summary
To use presentation previews, create a Google account and log in to it: https://accounts.google.com
Slide captions:
Graphs of trigonometric functions Function y = sin x, its properties Transformation of graphs of trigonometric functions by parallel transfer Transformation of graphs of trigonometric functions by compression and expansion For the curious…
trigonometric functions The graph of the function y = sin x is a sinusoid Properties of the function: D(y) =R Periodic (T=2 ) Odd (sin(-x)=-sin x) Zeros of the function: y=0, sin x=0 at x = n, n Z y=sin x
trigonometric functions Properties of the function y = sin x 5. Intervals of constant sign: Y >0 for x (0+2 n ; +2 n) , n Z Y
trigonometric functions Properties of the function y = sin x 6. Intervals of monotonicity: the function increases on intervals of the form: - /2 +2 n ; / 2+2 n n Z y = sin x
trigonometric functions Properties of the function y= sin x Intervals of monotonicity: the function decreases on intervals of the form: /2 +2 n ; 3 / 2+2 n n Z y=sin x
trigonometric functions Properties of the function y = sin x 7. Extremum points: X max = / 2 +2 n, n Z X m in = - / 2 +2 n, n Z y=sin x
trigonometric functions Properties of the function y = sin x 8. Range of values: E(y) = -1;1 y = sin x
trigonometric functions Transformation of graphs of trigonometric functions The graph of the function y = f (x +в) is obtained from the graph of the function y = f(x) by parallel translation by (-в) units along the abscissa The graph of the function y = f (x) +а is obtained from the graph function y = f(x) by parallel translation by (a) units along the ordinate axis
trigonometric functions Convert graphs of trigonometric functions Plot a graph Functions y = sin(x+ /4) remember the rules
trigonometric functions Converting graphs of trigonometric functions y =sin (x+ /4) Plot a graph of the function: y=sin (x - /6)
trigonometric functions Converting graphs of trigonometric functions y = sin x + Plot the graph of the function: y = sin (x - /6)
trigonometric functions Converting graphs of trigonometric functions y= sin x + Graph the function: y=sin (x + /2) remember the rules
trigonometric functions The graph of the function y = cos x is a cosine wave. List the properties of the function y = cos x sin(x+ /2)=cos x
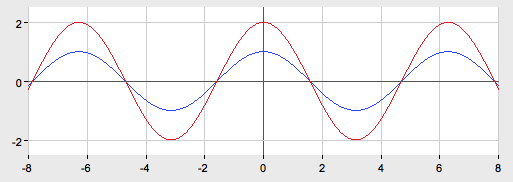
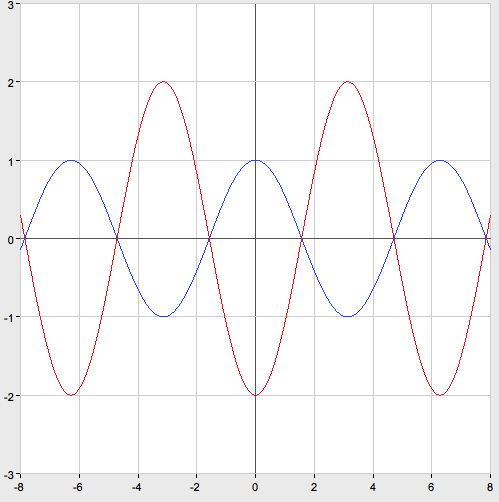
trigonometric functions Transformation of graphs of trigonometric functions by compression and stretching The graph of the function y = k f (x) is obtained from the graph of the function y = f (x) by stretching it k times (for k>1) along the ordinate graph The graph of the function y = k f (x ) is obtained from the graph of the function y = f(x) by compressing it k times (at 0
trigonometric functions Transform graphs of trigonometric functions by squashing and stretching y=sin2x y=sin4x Y=sin0.5x remember the rules
trigonometric functions Transformation of graphs of trigonometric functions by compression and stretching The graph of the function y = f (kx) is obtained from the graph of the function y = f (x) by compressing it k times (for k>1) along the x-axis Graph of the function y = f (kx ) is obtained from the graph of the function y = f(x) by stretching it k times (at 0
trigonometric functions Transform graphs of trigonometric functions by squashing and stretching y = cos2x y = cos 0.5x remember the rules
trigonometric functions Transformation of graphs of trigonometric functions by compression and stretching Graphs of functions y = -f (kx) and y=- k f(x) are obtained from graphs of functions y = f(kx) and y= k f(x), respectively, by mirroring them with respect to x-axis sine is an odd function, therefore sin(-kx) = - sin (kx) cosine is an even function, therefore cos(-kx) = cos(kx)
trigonometric functions Transform graphs of trigonometric functions by squashing and stretching y = - sin3x y = sin3x remember the rules
trigonometric functions Transform graphs of trigonometric functions by squashing and stretching y=2cosx y=-2cosx remember the rules
trigonometric functions Transformation of graphs of trigonometric functions by squashing and stretching The graph of the function y = f (kx+b) is obtained from the graph of the function y = f(x) by paralleling it by (-in /k) units along the x-axis and by compressing it in k times (at k>1) or stretching k times (at 0
trigonometric functions Transformation of graphs of trigonometric functions by squashing and stretching Y= cos(2x+ /3) y=cos(x+ /6) y= cos(2x+ /3) y= cos(2(x+ /6)) y = cos(2x+ /3) y= cos(2(x+ /6)) Y= cos(2x+ /3) y=cos2x remember the rules
trigonometric functions For the curious... Look at what the graphs of some other trigs look like. functions: y = 1 / cos x or y=sec x (read sec) y = cosec x or y= 1/ sin x read cosecons
On the topic: methodological developments, presentations and notes
TsOR “Transformation of graphs of trigonometric functions” grades 10-11
Curriculum section: “Trigonometric functions.” Lesson type: digital educational resource for a combined algebra lesson. According to the form of presentation of the material: Combined (universal) TsOR with...
Methodological development of a lesson in mathematics: “Transformation of graphs of trigonometric functions”
Methodological development of a lesson in mathematics: “Transformation of graphs of trigonometric functions” for tenth grade students. The lesson is accompanied by a presentation....
Algebra lesson notes in 10th grade
Vasilyeva Ekaterina Sergeevna,
mathematic teacher
OGBOU "Smolensk special (correctional)
comprehensive school of types I and II"
Smolensk
Lesson topic: “Transformation of graphs of trigonometric functions.”
Namemodule: converting graphs of trigonometric functions. Integratingdidactictarget: practice skills in constructing graphs of trigonometric functions. Target action plan for students:
- review the basic properties of trigonometric functions; practice the skill of converting graphs of trigonometric functions; promote the development of logical thinking; cultivate interest in studying the subject.
Bank of information.
Incoming control. Name the properties of the functions y = sin x (Fig. 1).Rice. 1
Properties:
- D(y)=R E(y)=[-1;1], the function is limited sin(-x)=-sinx, the function is odd Minimum positive period: 2π
sin (x+2πn)= sin x, n Є Z, x Є R. sin x=0 at x=πk, kЄ Z sin x>0, x Є (2πk;2π+2πk), k Є Z sin x Greatest the value equal to 1, y=sin x takes at the points x=π/2+ 2πk, k Є Z. The smallest value equal to -1, y=sin x takes at the points x=3π/2+ 2πk, k Є Z.
Rice. 2
Properties:
- D (y)=R E (y)=[-1;1], the function is limited cos(-x)= cos x, the function is even Minimum positive period: 2π
cos (x+2πn)=cos x, n Є Z, x Є R cos x=0 at x=π/2+πk, kЄZ cos x>0, x Є (-π/2+2πk; π/2+ 2πk), k Є Z cos x The largest value equal to 1, y=cos x takes at points x= 2πk, k Є Z. The smallest value equal to -1, y=cos x takes at points x=π+ 2πk, k Є Z.

Rice . 3
Properties:
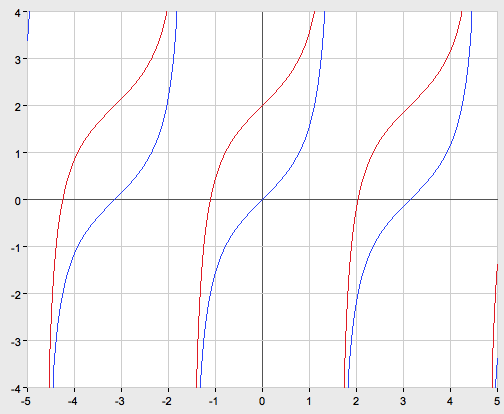
- D(y)-set of all real numbers, except numbers of the form x=π/2 +πk, k Є Z E(y)=(-∞;+ ∞), unbounded function tg(-x)=-tg x, odd function smallest positive period: π
tg(x+π)= tan x tgx= 0 at x=πk, k Є Z tg x> 0, x Є (πk; π/2+πk), k Є Z tg x

Rice. 4
Properties:
- D(y)-set of all real numbers, except numbers of the form x=πk, k Є Z E(y)= (-∞;+ ∞), unbounded function ctg(-x)=-ctg x, odd function Minimum positive period: π
ctg(x+π)=tg x ctg x = 0 at x=π/2+πk, k Є Z ctg x>0, x Є(πk; π/2+πk), k Є Z ctg x
Explanation of the material.
- y=
f(x)+
a, where a is a constant number, you need to move the graph y=
f(x)
along the ordinate axis. If a>0, then we move the graph parallel to itself upward, if a To construct a graph of the function y=
kf(x)
we need to stretch the graph of the function y=
f(x)
V k
times along the ordinate axis. If |
k|>1
, then the graph stretches along the axis OY, If 0k| , then – compression. Graph of a function y=
f(x+
b)
obtained from the graph y=
f(x)
by parallel translation along the abscissa axis. If b>0, then the graph moves to the left, if b
To graph a function y= f(kx) need to stretch the schedule y= f(x) along the abscissa axis. If | k|>1 , then the graph is compressed along the axis OH, if 0
Fixing the material.
Level A
Privatedidactictarget: practice the skill of constructing trigonometric functions using transformations.
Methodicala commentForstudents:
Ox 3 times.

The graph of a function is obtained from a graph by stretching along the axis Oy 2 times.
The graph of the function is obtained from the graph by parallel translation 2 units up along the axis Oy.
The graph of a function is obtained from the graph by parallel translation along the abscissa axis by units to the left.

G 
The graph of a function is obtained from the graph by compressing along the axis Oy 4 times.
Level B.
Privatedidactictarget: trigonometric functions by consistent applying transformations.
Methodicala commentForstudents: construct graphs of functions by performing transformations.
The graph of a function is obtained from the graph by parallel translation along the abscissa axis by units to the right.
The graph of a function is obtained from the graph of a function by sequentially performing the following transformations:
1) parallel translation by units to the left along the abscissa axis
2) compression along the Oy axis by 4 times .

The graph of the function is obtained from the graph of the function, each ordinate of which changes by a factor of -2. To do this, we perform the following transformations:
1) display symmetrically about the axis Ox,
2) stretch 2 times along the axis Oy.
consistent perform the following transformations:
1) compression along the abscissa axis by 2 times;
2) stretching V 3 times along axes Oy;
3) parallel transfer on 1 unit up along axes ordinate.
Level WITH .
Privatedidactictarget: practice graphing skills trigonometric functions by consistent applying transformations.
Methodical a comment For students : please indicate , which transformation need to execute For construction graphs . Build graphics .
1. ![]()
The graph of a function is obtained from the graph of a function by sequentially performing the following transformations:
1) display is symmetrical about the axis Ox,
2) compression by 2 times along the Oy axis;
3) parallel translation 2 units down along the Oy axis.
2.
![]()
The graph of a function is obtained from the graph of a function consistent performing the following transformations: it turns out www. aiportal. ru/ services/ graph. html
SUBJECT: Transformations of graphs of trigonometric functions with modulus.
TARGET: Consideration of obtaining graphs of trigonometric functions of the form
y= f(|x|) ;y = | f(x)| .
Develop mathematical logic and attention.
DURING THE CLASSES:
Org. moment: Announcement of the topic, goals and objectives of the lesson.
Teacher: Today we must learn how to graph functions y = sin |x|; y = cos|x|
Y = |A sin x +b| ; Y = |A cos x +b| using our knowledge of transformations of transcendental functions of the form y = f(|x|) and y = |f(x)| . You may ask, “What is this for?” The fact is that the properties of the functions change in this case, but this is best seen, as you know, on the graph.
Let's remember how these functions are written using the definition
Children: f(|x|) =
|f(x)| = ![]()
Teacher: So, to plot the function y =f(|x|), if the graph of the function is known
y =f{ x), you need to leave that part of the graph of the function y = in placef(x), which
corresponds to the non-negative part of the domain of definition of the function y =f(x). Reflecting this
part is symmetrical about the y-axis, we get another part of the graph corresponding
negative part of the domain of definition.

That is, on the graph it looks like this: y = f (x)
(These graphs are drawn on the board. Children in notebooks)
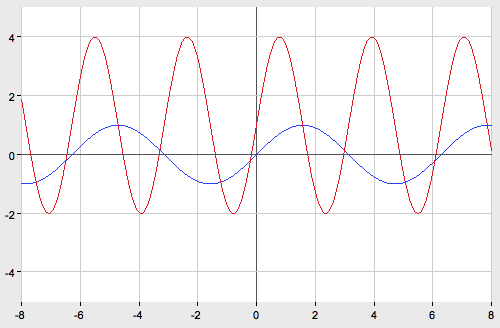
Now, based on this, we will construct a graph of the functions y = sin |x|; Y = |sin x | ; Y = |2 sin x + 2|

Fig 1. Y = sin x

Figure 2. Y = sin |x|
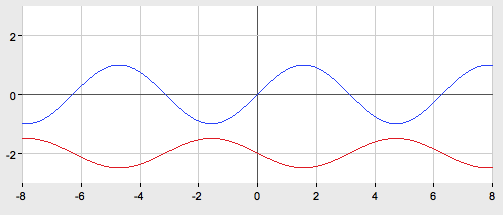
Now let's plot the functions Y = |sin x | and Y = |2 sin x + 2|
To plot the function y = \f(x)\, if the graph of the function y = is knownf(x), you need to leave in place that part wheref(x) > ABOUT, and symmetrically display its other part relative to the x-axis, wheref(x) < 0.
- Converting graphs of trigonometric functions Examples of converting graphs of trigonometric functions
- Operation Bagration and its military-political significance
- Location of military resources to Horizon
- International system of units of physical quantities Si
- Sinkwine content in the photo of which I am not
- Population of Siberia: number, density, composition
- Children's fairy tales online What doesn't happen in the world illustrations